
Graphing Activity
Hey everyone! Welcome to the Citizen Science GIS Maps, Apps, and Drones Tour online! We are so glad you joined us. This week we will be doing a graphing activity using latitude and longitude points. The activity should take roughly 30 minutes.

Check out this week's instructional video on the different types of graphs, their characteristics, important geographical terms, and guided graphing activity!
Option 1: We suggest printing it out and you can usedifferent colored pens and pencils to add in the coordinate points, title, andx/y axis labels.
Option 2: If you don’t have access to a printer – you should be able to annotate directly on the PDF. If you are using a Mac device:
- Download and open the PDF using the ‘Preview’ App.
- Once you have the file open, go to the top, find and click the “Tools” Tab. A drop-down menu will appear.
- Then select “Annotate”. You can then select ‘Text’ for the labels/title and a shape, such as an oval or star for the points.
- You can change the size of the shape using the blue dots around the object.
- Likewise, you can also change the color if you’d like!
Option 3: If you don’t have access to a printer – you should be able to annotate directly on the PNG. If you are using a PC Device:
- Open Microsoft Paint and open the 'Cartesian Graph Final.png' file
- Using the 'File' Tab select 'Open' to display the image.
- Using the different Shape options (i.e. Oval, Square, Triangle, Arrow) select a shape for the points.
- Similarly, you can change the size, color, or shapes of each point
- You may also use the zoom-in feature with the magnifying glass to see points or numbers closer up.
The Activity:
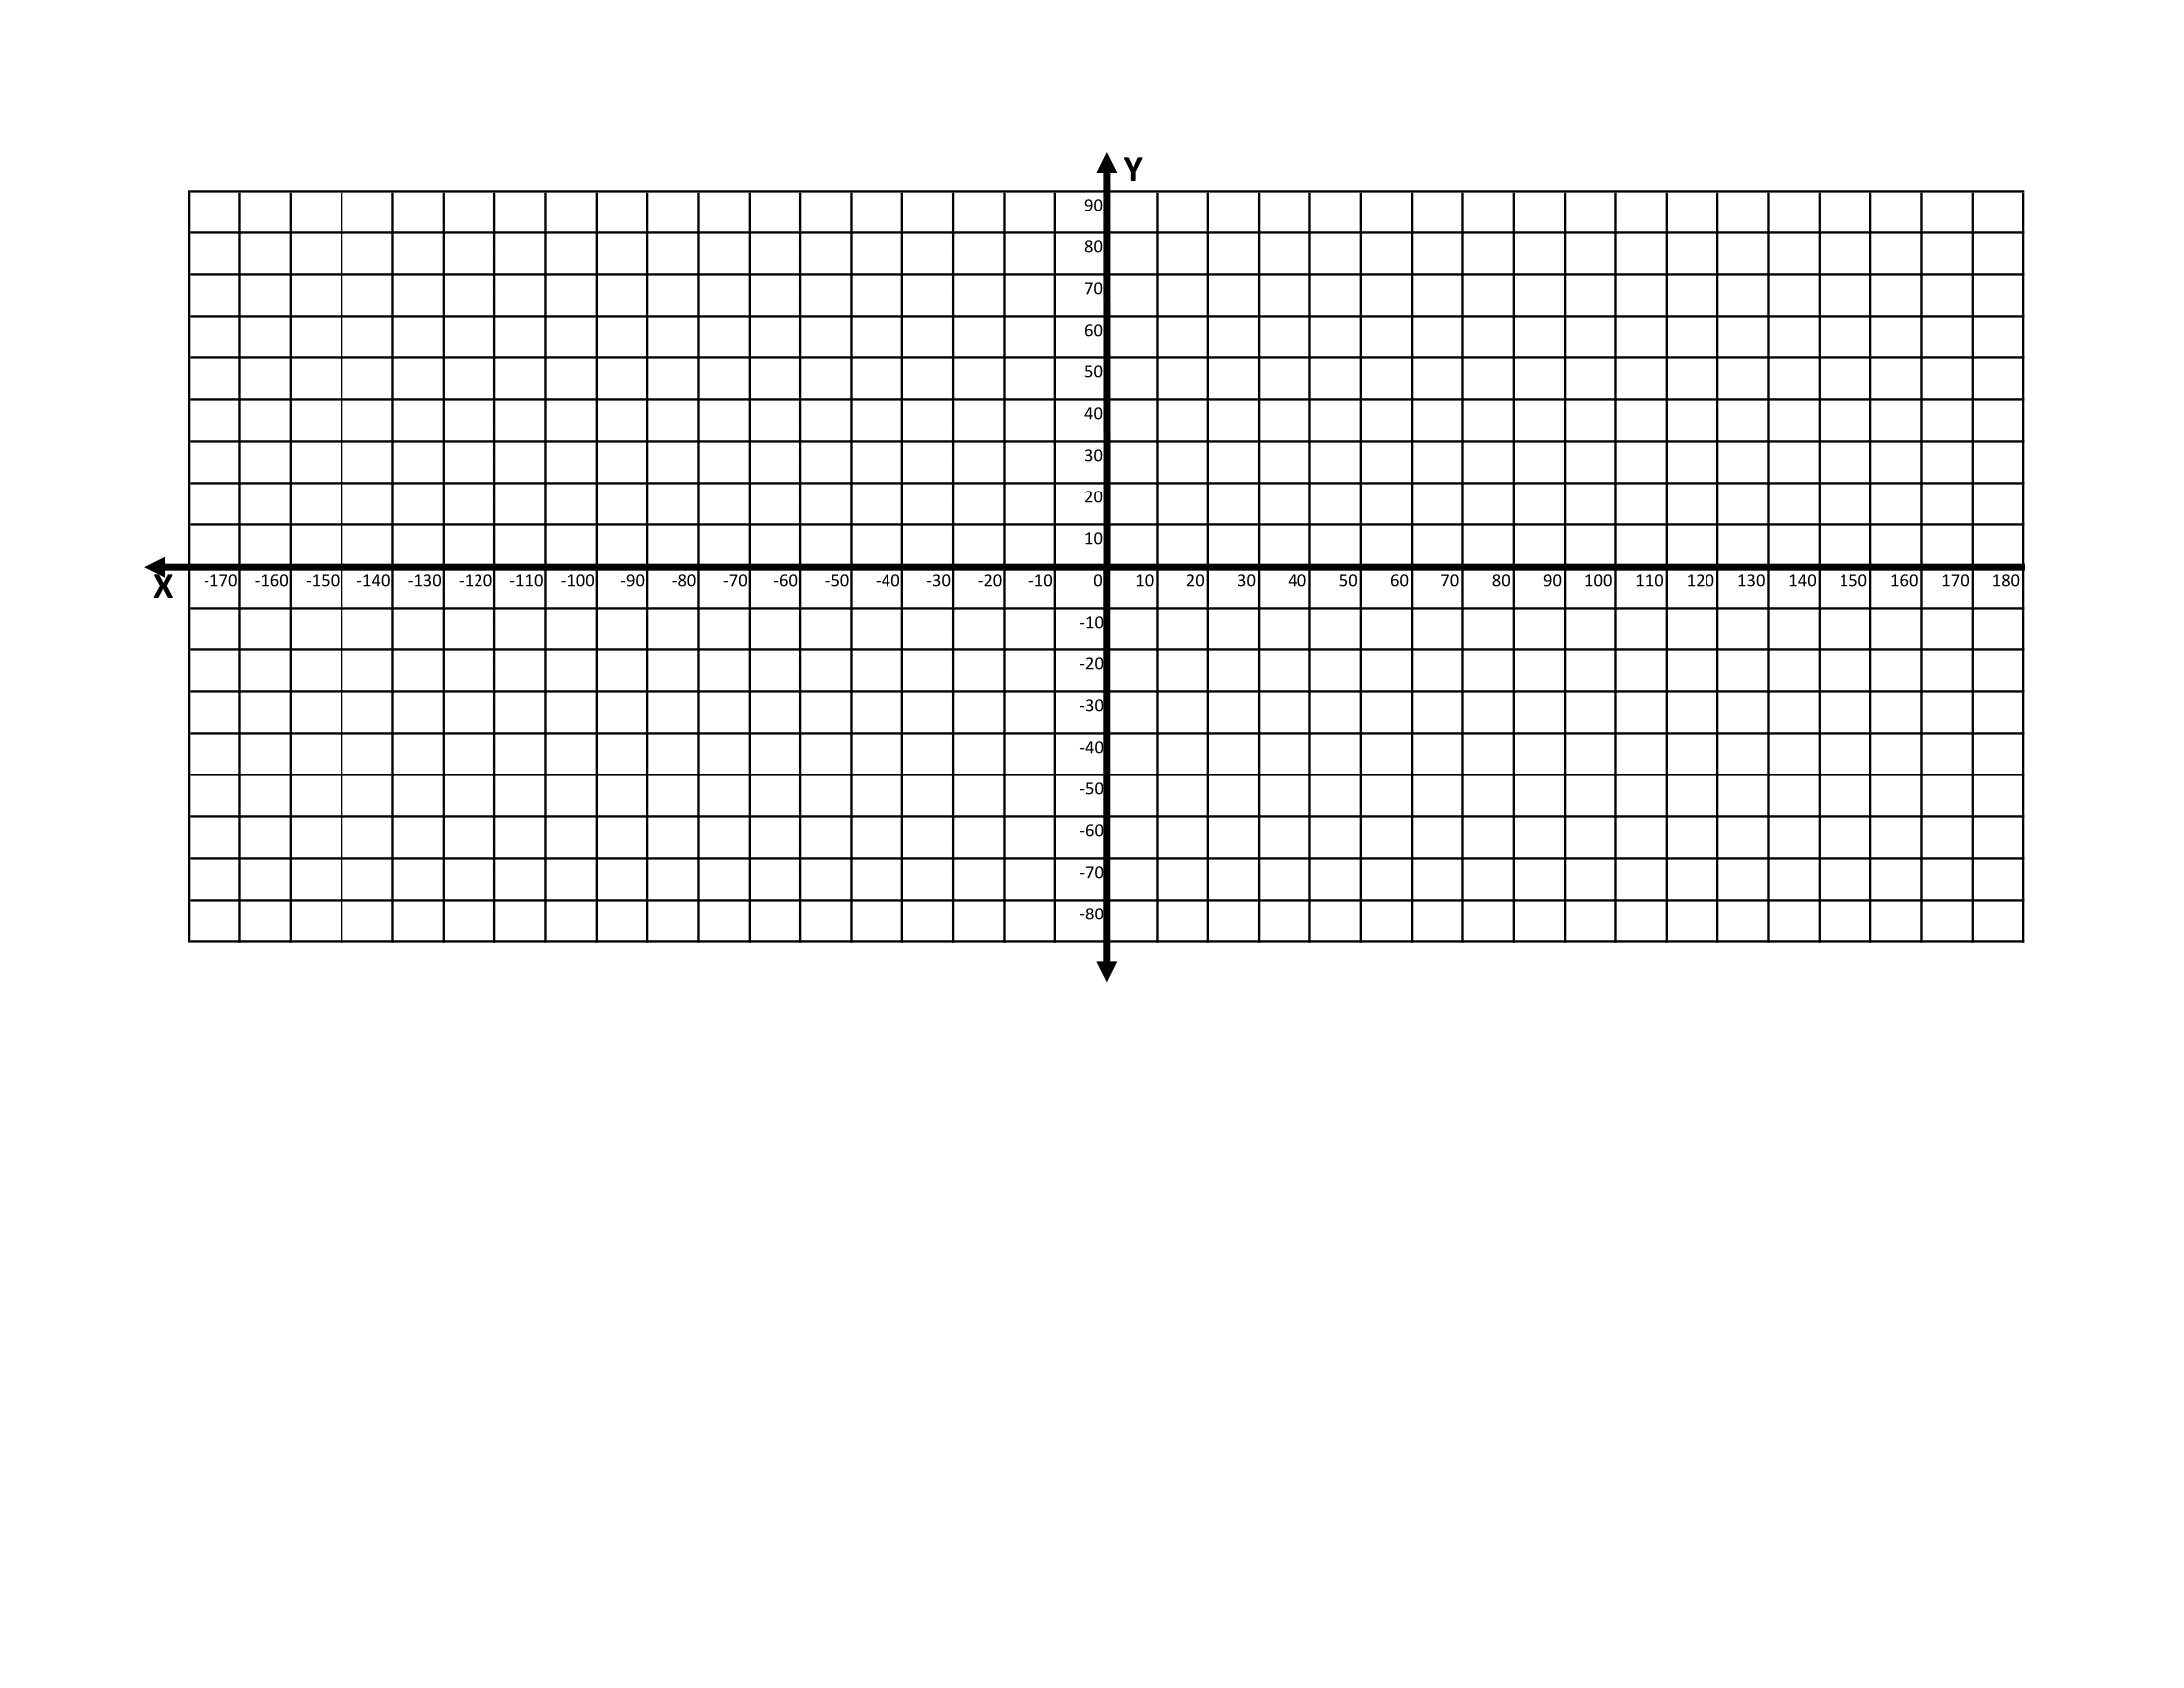
- To start, give your graph a title. You can be as creative as you want or keep it simple like “The Earth Grid”.
- Point out the Equator and Prime Meridian on the graph as this will help you determine the location of the coordinate points and help you figure out which axes should be latitude and longitude.
- The X-axis represents the Equator and the Y-axis represents the Prime Meridian!
- Next, we need to label our x/y axes. Do you know what the Y-axis label should be?
- The Y-axis label is “Latitude” because latitude measures the degrees North or South of the equator!
- This label will go on the left side of the graph.
- Do you know what the X-axis label should be?
- The X-axis label is “Longitude” because longitude measures the degrees East or West of the Prime Meridian.
- This label will go below the graph.
- In this activity, your axes have already been numbered for you and are increasing (or decreasing) by increments of 10.
- You can add a compass rose to your graph to help you keep track of the cardinal directions N, W, S, E.
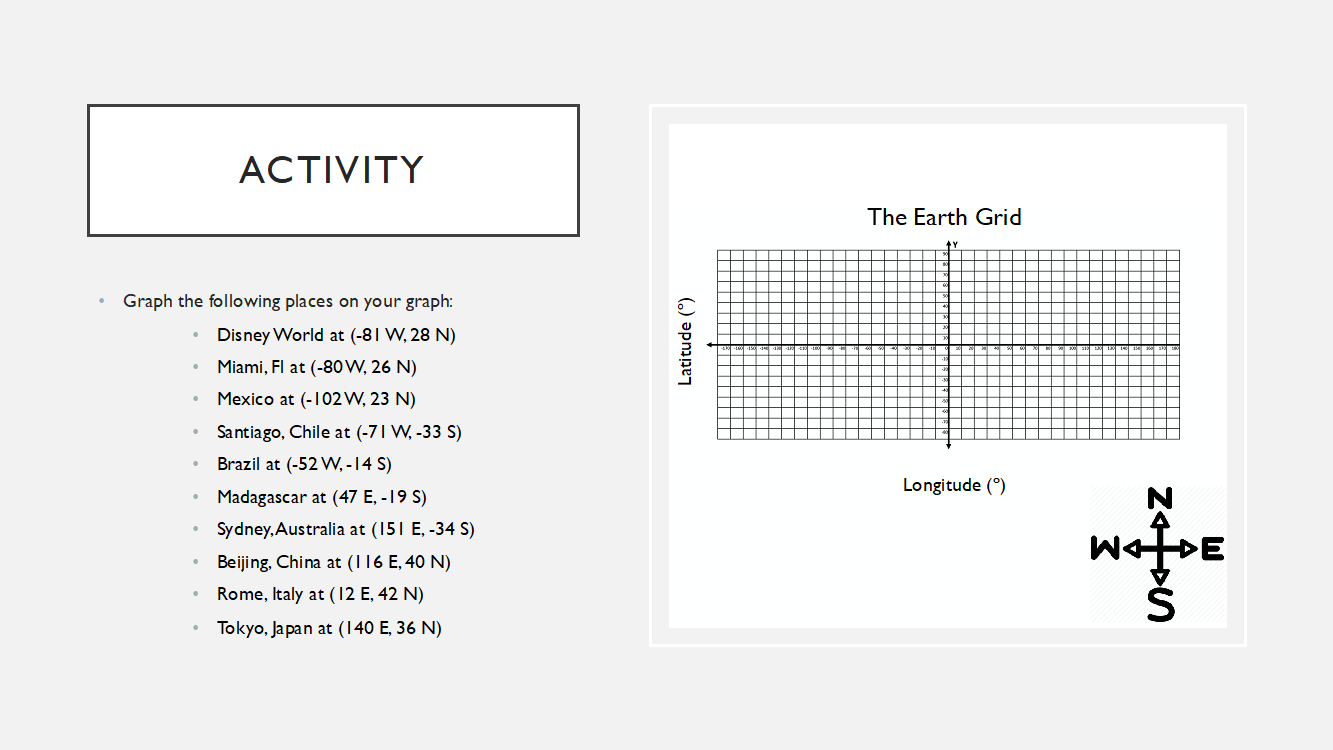
- Lastly, remember what we learned about ordered pairs, hemispheres, our negative and positive values, latitude and longitude, and the Equator and Prime Meridian and begin graphing the points on your cartesian coordinate plane. (Estimate the location of the points if the exact value isn’t shown on the graph).
- Disney World at (-81 W, 28 N)
- Miami, FL at (-80 W, 26 N)
- Mexico at (-102 W, 23 N)
- Santiago, Chile at (-71 W, -33 S)
- Brazil at (-52W, -14 S)
- Madagascar at (47 E, -19 S)
- Sydney, Australia at (151 E, -34 S)
- Beijing, China at (116 E, 40 N)
- Rome, Italy at (12 E, 42 N)
- Tokyo, Japan at (140 E, 36 N)
Don't forget to share your creations with us on our social media pages!
We hope you enjoyed this week’s activity with the Maps, Apps, and Drones Tour online! Everyone here at Citizen Science UCF hopes you and your family stay safe and healthy during this difficult time.
Don’t forget to join us next Thursday for another
Maps, Apps, and Drones Tour online activity!